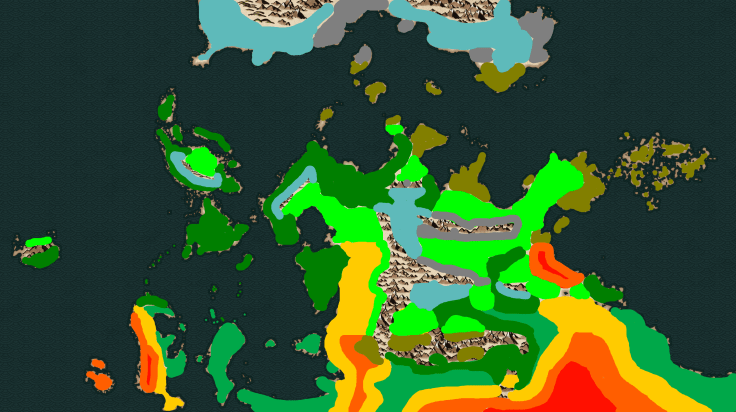
In this guide we will be attempting to apply realistic climates to a map of our world, ending up with something like this, here each colour denotes a different climate. It won’t be 100% scientifically accurate but for the purposes of worldbuilding its close enough.
 The primary resources involved in writing this are Geoff’s Climate Cookbook and Emma Lindhagen’s Ocean Currents Tutorial. This guide is a walk-through of both of these tutorials combined. I encourage you to check out these great resources for more information.
Use a program such as Photoshop or GIMP and do every step on a different layer as you will want to toggle visibility regularly throughout this process.
In The Beginning
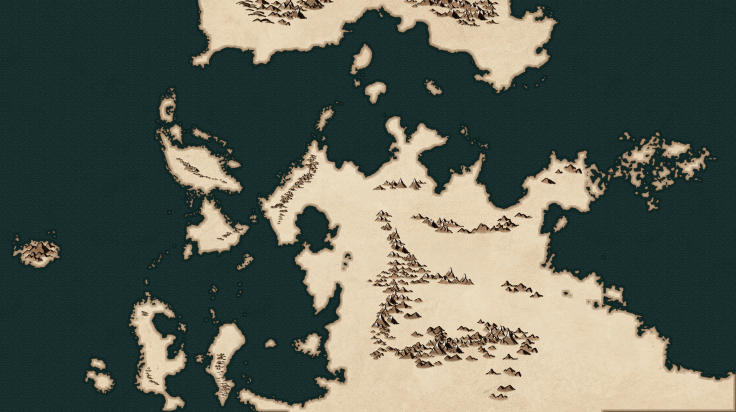
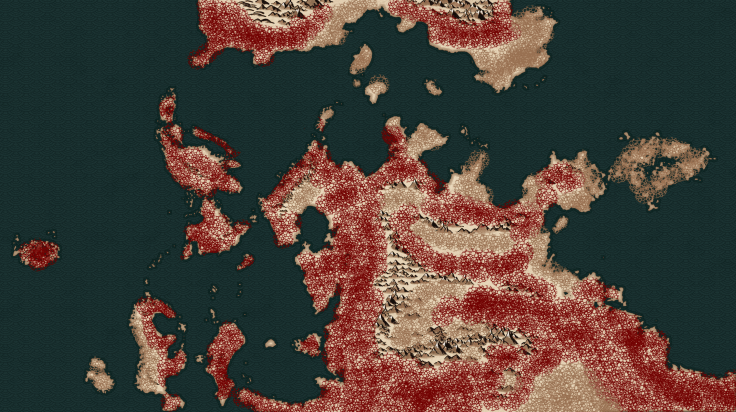
We will need a map depicting our landmasses and mountains as our starting point.
Great Ocean Conveyor Belt
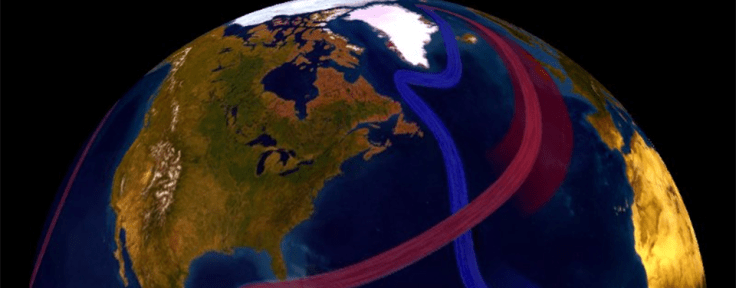
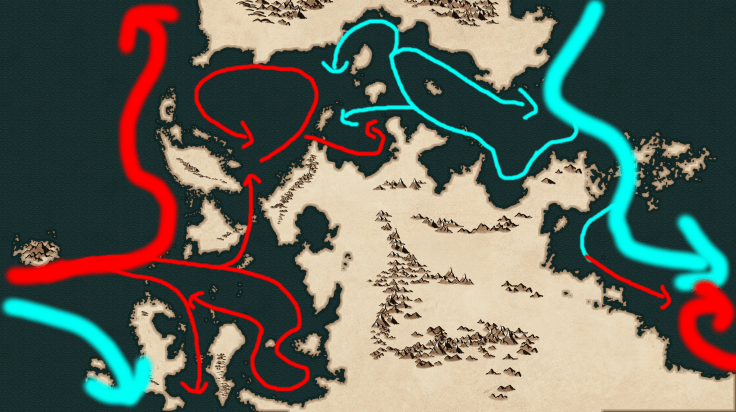
The first thing we need to work out is the location of our Great Ocean Conveyor Belt. This is the constantly moving circuit of system of water which flows around the planet. The exact reasons for the belt’s path are complex and so as long as you follow the basic rules you can place it where you want in your world and it can still be geologically correct within your world.
- The GOCB carries cold water from the poles towards the equator, and warm water from the equator towards the pole
- Geoff’s Climate Cookbook (depicted below) states that in the northern hemisphere that warm currents flow on the west of continents and cold, on the east

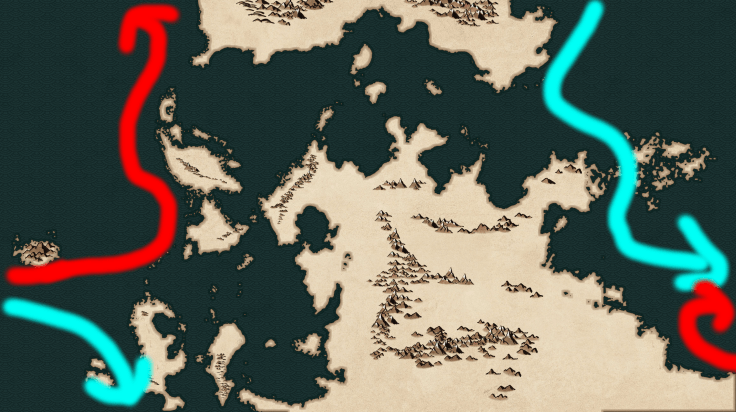
Our map is only for a section of the world so only part of the Great Ocean Conveyor Belt is depicted. When applied to our world, we get the following.
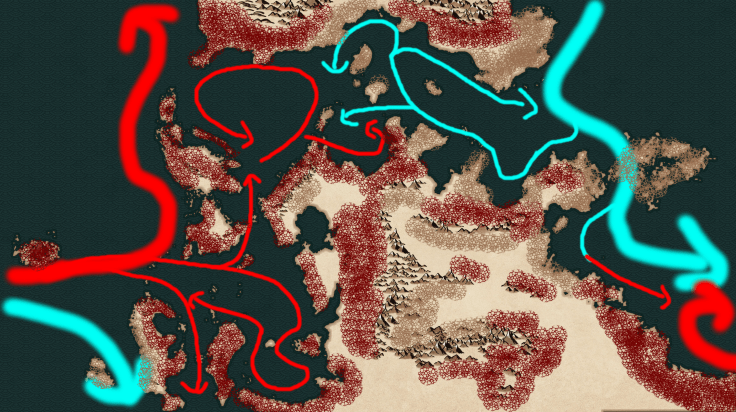
Surface Currents
The belt determines where our surface ocean currents flow from.
- Currents north of the equator will turn clockwise.
- Currents south of the equator will turn counterclockwise
- Currents will change course when they run into land
- Cold currents may overlap the cold GOCB (because it is deep-sea), but not the warm GOCB (as it flows nearer the surface)
- Currents may change temperature as they near the equator/poles
Applied to our map we get this. You might notice we have some currents flowing anti-clockwise as a result of being deflected off landmasses.
High and Low Pressure
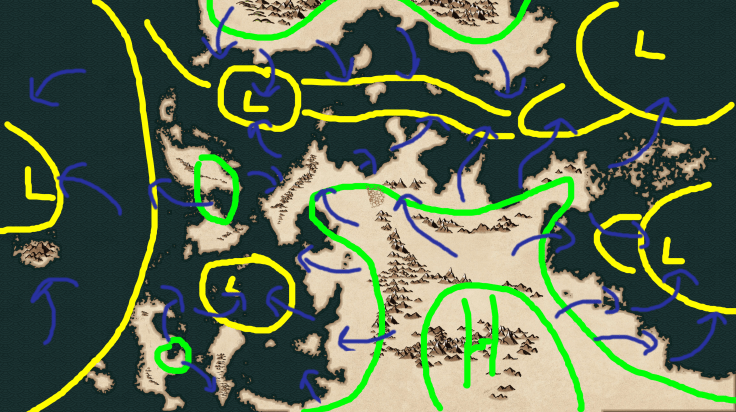
Next you want to work out your areas of high and low pressure.
- In summer (left), the cooling of the ocean causes high pressure, with low pressure areas over the land.
- In winter (right), the cooling of the ground causes high pressure, with low pressure areas over the ocean.


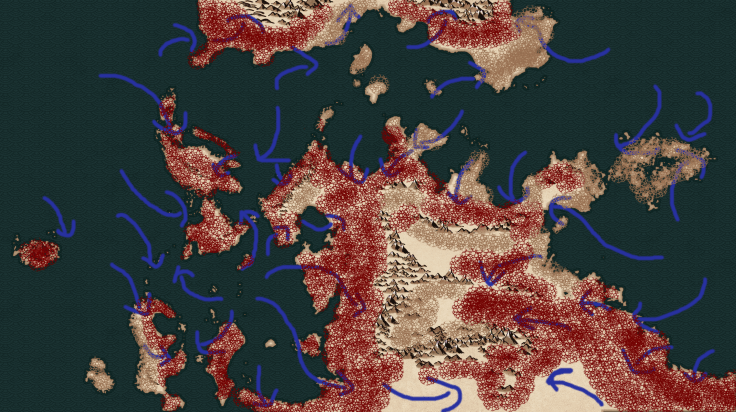
Winds
Prevailing winds flow clockwise out of high pressure zones and anti-clockwise into low pressure zones, so do one for summer and one for winter.
Summer
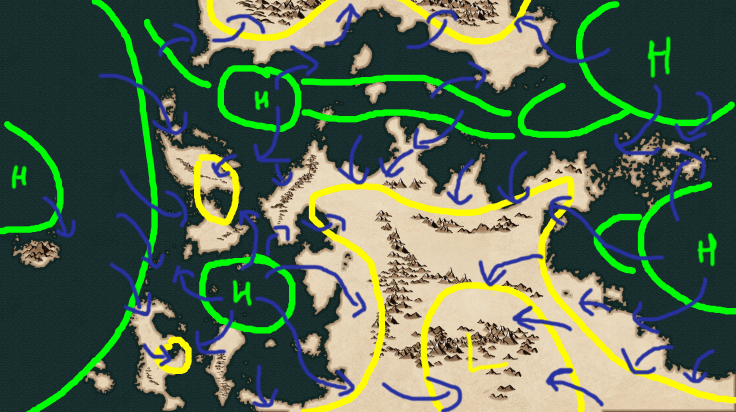
Winter
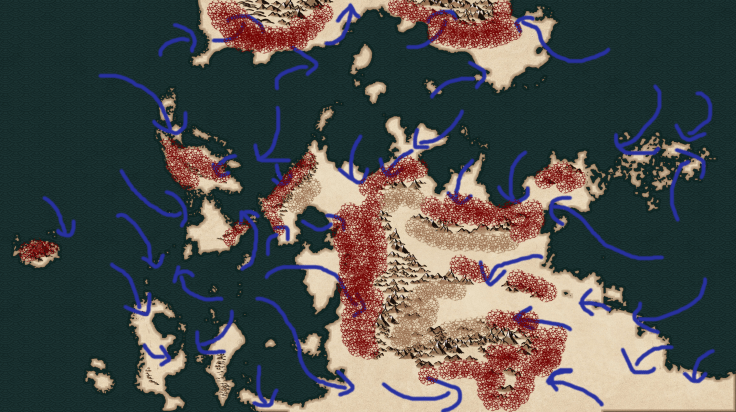
Precipitation
This is where things begin to take shape. Remember here precipitation includes snow, so don’t get stumped if you have high precipitation in the regions you were expecting to be snowy wastelands.
- Paint on two colours, representing high (darker colour) and low precipitation (high colour). These are relative terms and will be made more specific to the climate later on.
Mountains
First look to your mountains and the surrounding winds.
- Mark high precipitation where the winds blow onto the mountains
- Mark low precipitation in the rain shadow of the mountains
In summer, our map will look like this.
Ocean Currents
- Warm currents will result in high precipitation
- Cold currents will result in low precipitation
Our summer map now looks like this
Winds
- Onshore winds cause high precipitation
- Offshore and parallel winds cause low precipitation
You might already have your coastlines accounted for from previous steps, so when applying this effect, you might be marking zones more inland than your currents. Don’t overlap your precipitation markings, apply next to them. After this step we will only have the interiors of our biggest landmasses still to define.
Our map now looks like this.
Interiors
There may not be loads of land left to cover, but interiors on our larger landmasses might still need looking at.
- Mark extreme interiors as low precipitation
- Near the equator mark low precipitation
- Away from the equator, mark high precipitation
- Western interiors are more likely to have high precipitation
Our Precipitation Maps
Once we have done this for both summer and winter, we have the following.

Latitude Guide
In order to work out what our climates are, we need to divide the map into equal sized horizontal strips based on degrees of latitude . For the northern hemisphere, make 10 strips, with each line up from the equator denoting 10 degrees. I decided to finish my map at 70 degrees north, to leave the arctic region an unknown area.
To do in GIMP,
- Go Image -> Configure Grid
- Set Width to something wider than your image, so its not cluttered
- Divide the height of your image in pixels by how many strips you want
- Set Height to the result
- View -> Show Grid
You should also have a general idea of how a height map of your world would look. I am generally assuming there are hills around the mountains and flattens out towards the coast. You can make this up as you go along.
Discovering Your Climates
- Toggle between your winter and summer precipitation layers to see the precipitation for each area.
- Compare the latitude
- Find the corresponding climate
- Use a colour code to denote the climate
For example, once you know a strip of land is wet in summer and dry in winter, compare the latitude to the table and find the corresponding wet summer and dry winter climate.
Use the following table to figure out your climates. There is a simplified table further down. Check out this post for more information on the biomes and their features.
| Temperature | Precipitation | Location | |||
| Name | Summer | Winter | Summer | Winter | latitude in degrees |
| Tropical rainforest | Hot | Hot | Wet | Wet | 0-10 |
| Tropical monsoon | Hot | Warm | Very wet | Short and dry | 5-15; east and south-east coasts only |
| Savannah | Hot | Warm | Wet | Long and dry | 5-15 |
| Hot desert | Very hot | Warm | Dry | Dry | 10-30, especially on west coasts with cold currents |
| Hot steppe | Hot | Warm | Low to dry | Low to dry | 10-35; typically next to deserts |
| Cold desert | Hot | Cold | Dry | Dry | Interiors, rain shadow |
| Cold steppe | Warm | Cold | Low to dry | Low to dry | Interiors, rain shadow |
| Maritime east coast | Hot | Warm to mild | Wet | Moderate | 20-40; east coasts only |
| Maritime west coast | Warm to mild | Cool to cold | Wet | Wet | 40-60; west coasts only |
| Mediterranean | Hot | Mild | Dry | Moderate | 30-45, west coasts only |
| Temperate monsoon | Hot | Mild to cold | Wet | Dry | 20-40; east coasts only |
| Laurentian | Warm to mild | Cold | Moderate | Low | 40-60; not on west coasts |
| Subarctic | Mild to cold | Very cold | Moderate | Very low | 60-80; not on west coasts |
| Manchurian | Warm to mild | Cold | Moderate | Dry | 40-50; east coasts only |
| Subarctic east | Mild to cold | Very cold | Moderate | Dry | 45-70; east coasts only |
| Tundra | Cold | Very cold | Low | Dry | 60-80 |
| Icecap | Very cold | Very cold | Low | Dry | 75+ |
Simplified Table
If you are like me and find this table is a bit much. Consider using this simplified table below.
| Temperature | Precipitation | Location | |||
| Name | Summer | Winter | Summer | Winter | |
| Desert | Hot | Hot | Dry (Low) | Dry (Low) | 0 – 30 |
| Semi- Arid Desert | Hot | Hot | Wet (High) | Dry (Low) | 0 – 15
Surrounds Desert |
| Tropical | Hot | Hot | Wet (High) | Wet (High) | 0-20 |
| Savannah | Hot | Warm | Wet (High) | Long and Dry (Low) | 15 – 30
Between Tropical and semi-Desert |
| Steppe | Warm | Cold | Low | Dry (Low) | 30 – 60 |
| Temperate Grassland | Warm to Mild | Cold | Moderate (High) | Low (Low) | 20 – 65 |
| Temperate Forest | Warm to Mild | Cold | Moderate (High) | Low (Low) | 20 – 65 |
| Taiga | Cold | Very Cold | Moderate (High) | Dry (Low) | 50 – 70 |
| Tundra | Cold | Very Cold | Low | Dry (Low) | 60 – 80 |
| Icecap | Very Cold | Very Cold | Low | Dry (Low) | 75+ |
So far
Applying this to a work-in-progress map we get the following.
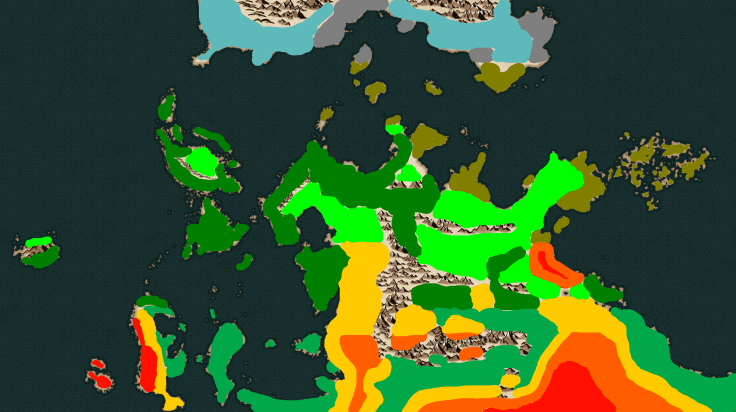
These colours represent the following:
- Grey: Tundra
- Teal: Taiga
- Dull Green: Steppe
- Light Green: Temperate Grassland
- Dark Green: Temperate Forest
- Off-Green: Tropical Rainforest
- Yellow: Savannah
- Orange: Semi-Arid Desert
- Red: Desert
Elevation and Tidy Up
As the environment rises in elevation it cools. For elevated areas look again at the table and see what climates the corresponding amounts of precipitation would result in if you looked at the cold row rather than warm.
For example, if we elevate a template grassland we get tundra. If we elevate savanna, we get steppe.
- Apply this around your mountains and anywhere else you want to show elevation.
- Thin strips would show steep gradient whereas larger blobs of colour would show a more gradual change, or even a plateau.
It wouldn’t make sense to have desert next to water, so if you have this in your map, go along the coast to replace it with semi-arid desert.
Apply this to our map and we get this!
Artistic Direction
The nice thing about worldbuilding like this is your result feels accurate and therefore real. But you don’t have to follow the rules, its your world remember! If you want to change things around, by all means go ahead, but you’ve got a realistic starting point here to add your own creativity if you wish!

Leave a comment