Posting on behalf of u/Jagged_Orchid
Pre-requisite: Download the free application G.Projector:
https://www.giss.nasa.gov/tools/gprojector/download/
This guide describes my process for building a full map of a spherical world starting from scratch, but this method can be adapted in several ways to allow editing of already created polar regions of existing maps and is also useful for visualizing distortions in your map that you may not be aware of. For this method to work accurately you must use a 2:1 canvas size, which equates to an equirectangular projection of your world. You should always work with the equirectangular projection in the early stages of map making. Once you have a full world map created in equirectangular form you can use programs like G.Projector and various other tools to produce any other projection type you would like.
Note: Equirectangular is great because it is the only projection that can easily be used to generate any other. I do not recommend using the equirectangular projection for ‘published’ maps that are intended to be ‘useful’ to the people of your world. There are many projections that are useful for different reasons, equirectangular is not one of them but I won’t get more into that in this post.
Step 1: Rough layout of primary landmass shapes, polar regions left blank
Create a new file in Wonderdraft with dimensions 7488px by 3744px choose a black and white theme (this will make it easier to import your polar regions as a height map later). This specific resolutions accounts for limitations in how Wonderdraft handles grid size and the maximum allowable input/output resolution of G.Projector. Give this file a meaningful name like ‘Full Map Comp’.
Note that once you’ve gone through the whole process described in this post you can upscale your completed Wonderdraft file and continue the detail work as you see fit.
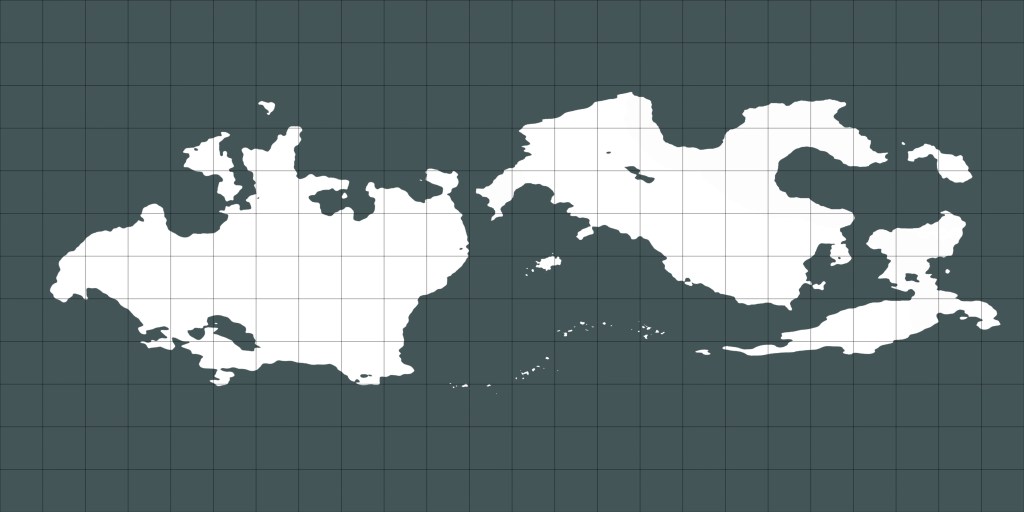
In your file create a square grid in the overlay section at a size of 312px. add the rough shapes of your land masses (details can come later). You should leave your polar regions blank (the area covered by the top and bottom two or three rows of your grid) these regions are hard to get right without following my method because of the significant distortion the equirectangular projection adds to the polar regions of your world.
Export your image with the grid included and name it ‘Full Map – No Polar Regions’.
Step 2: Oblique Equirectangular projection of rough map with polar regions in centre.
Open G.Projector and chose the image you just exported when prompted. When the dialog box ‘Input Map Options’ appears Leave everything as is and click ‘Okay’. G.Projector has two overlays it automatically applies that you will need to disable: in the ‘Graticule’ dialog box where it says ‘Stroke’ select ‘None’; in the ‘Overlay’ dialog box where it says ‘Overlay 1’ select ‘None’.
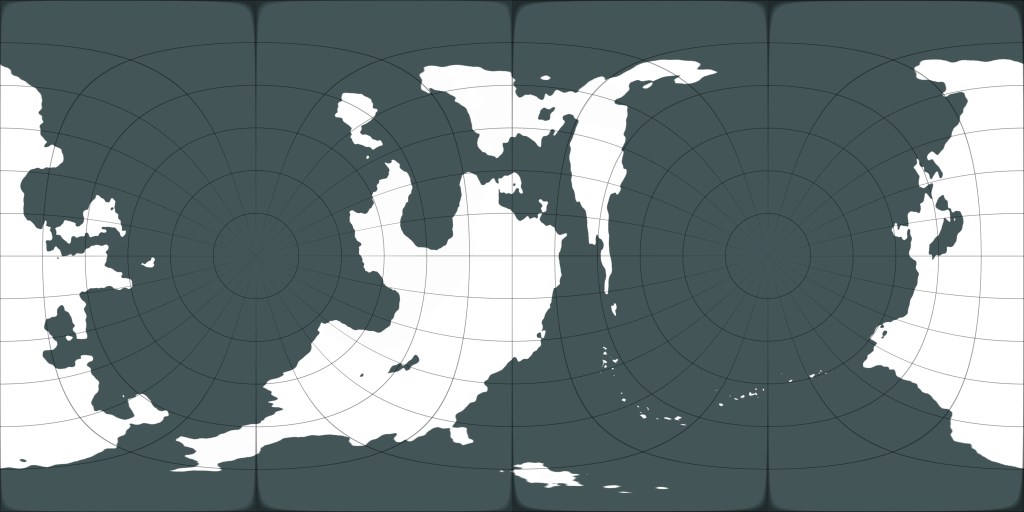
In the projection dialog box where it says ‘Name:’ click on the drop-down menu and type ‘e’ then scroll and find ‘Equirectangular (Oblique)’. Where it says, ‘Centred on Lon’ (longitude) choose 0° E (East) set ‘lat’ (lattidude) to 90°N (North). You will notice how extremely distorted your non-polar landmasses now look, this distortion is always present no matter the centred co-ordinates and is simply the nature of trying to project the surface of a sphere onto a two-dimensional plane.
From the file menu choose ‘Save Map As’ and give it the name ‘Polar Regions Centred’ set the resolution of the image to 7488 x 3744 (same as Wonderdraft) and make sure that ‘Add small margin to above’ is not ticked. Close G.Projector.
Open G.Projector again and choose the image you just created. Disable the overlay and graticule as before and now select ‘Equirectangular’ (not oblique this time) from the map projection and centre it on longitude 90° East and save your map again overwriting the file you just created as you no longer need this file in its original form, this will should help streamline the process. What you have done is placed your polar regions in the least distorted part of the map. the grid overlay here illustrates how the distortion works, each line of latitude is a perfect circle, but the rectangular projection makes it appear that the equator is a perfect square.
Step 3: Creation of polar landmasses
Create a new Wonderdraft file with the dimensions 7488px by 3744px Give it the name ‘Polar Regions Only’. This file will be used to create your polar landmasses. Do not bother with a grid overlay this time instead import the file ‘Polar Regions Centred’ using the trace tool and set the opacity as you like. Have fun designing your polar regions and be as creative as you like; polar landmasses don’t have to be vaguely Antarctica shaped blobs as is a common trope in fantasy maps. I recommend being a bit more detailed here as it is hard to add detail once your polar regions are added back to the top and bottom of the map.
Step 4: Polar landmasses exported, grid overlay disabled

Once completed, export your new map and give it a name like ‘Polar Regions Only – Centred’, make sure you do not export the trace layer.
You now need to use G.Projector to return the polar regions to their original location by effectively reversing the steps you took to get here in the first place. Open G.Projector and select the file you just created turning off superfluous layers as before. Under projection choose equirectangular standard and set the longitude value to -90° East. Save this map and overwrite the ‘Polar Regions Only – Centred’ file.
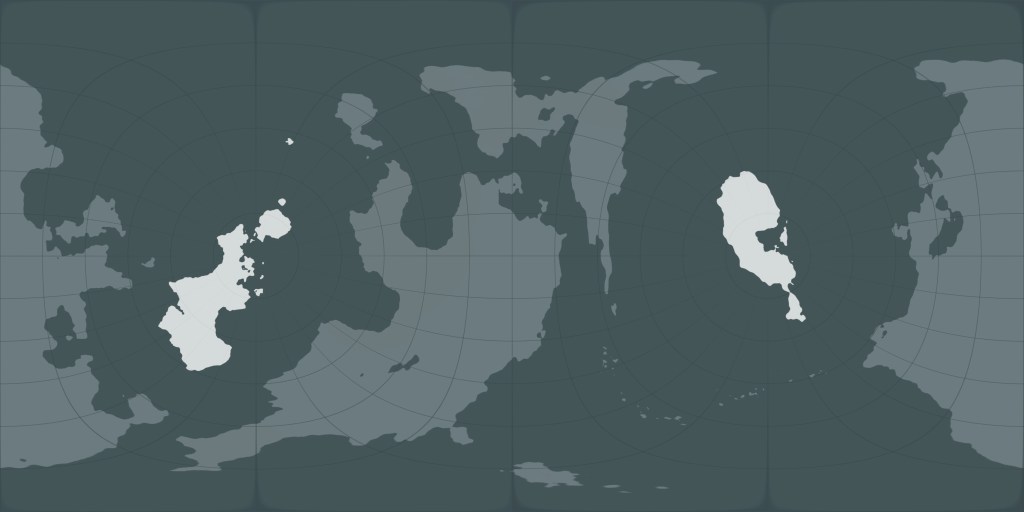
Step 5: Equirectangular projection returning polar regions to top and bottom of map

Open G.Projector again and choose the same ‘Polar Regions Only – Centred’ file once more.
Choose the equirectangular oblique projection this time and set the longitude to 0° East and the latitude to -90° North. If this has been done correctly you should now see your polar regions stretched out over the top and bottom of your map. Save the map as ‘Polar Regions Only’
Step 6: Height map imported into original file, continue editing from here

Open your original Wonderdraft file ‘Full Map Comp’ and import the file ‘Polar Regions Only’ as a height map. If you’ve done this correctly Wonderdraft should add the polar regions into the file without affecting your primary landmasses. You are now free to continue the long and rewarding process of map making; now, a little bit more aware of the inherent distortions of working in two dimensions.
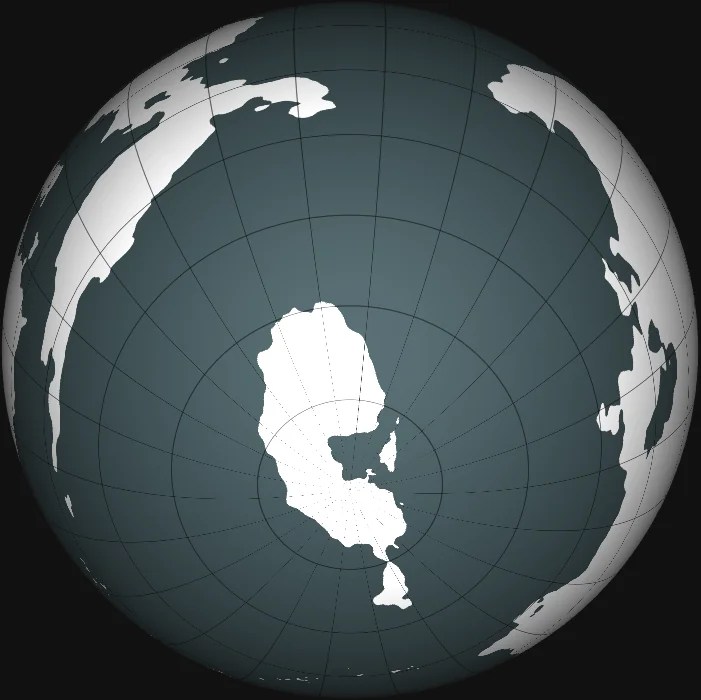
North polar region view using ‘maptoglobe.com’

South polar region view

It good
LikeLike
Thanks for the tutorial, but is there a way to do it without using Wonderdraft and G.Projector?
LikeLike